User Guide
Getting Started
This User Guide will help you setup your account, add your websites and start viewing them in Dataviz Studio.
Overview
Setting up and using Dataviz Studio is simple and straight forward.
1. Sign Up for an account
2. Add your website in Dataviz Studio
3. Add tracking code to your website
4. Add events tracking to your website (optional)
5. View Dashboard
Account Setup
Once you have completed the signup process, you will be assigned a dedicated instance of Dataviz Studio which you can access using the link provided in the User Portal.
You would have also received an email from us providing you with the URL of your Dataviz Studio server along with the login credentials.
Please use the provided URL to visit your Dataviz Studio server and enter your credentials to login.
Once you are signed in, you would find yourself in the 'Dashboards Home Page'. Here you will find the following tabs:
Provides a list of existing Dashboards.
2. Data Tables
Here you can view statistics about different tables in the database storing page views, events and sessions information.
3. Settings
Here you can add websites and users. You can also view the 'tracking code' for each website here.

Add your websites
Step 1.
Click on the 'User Settings' tab to view the following page:
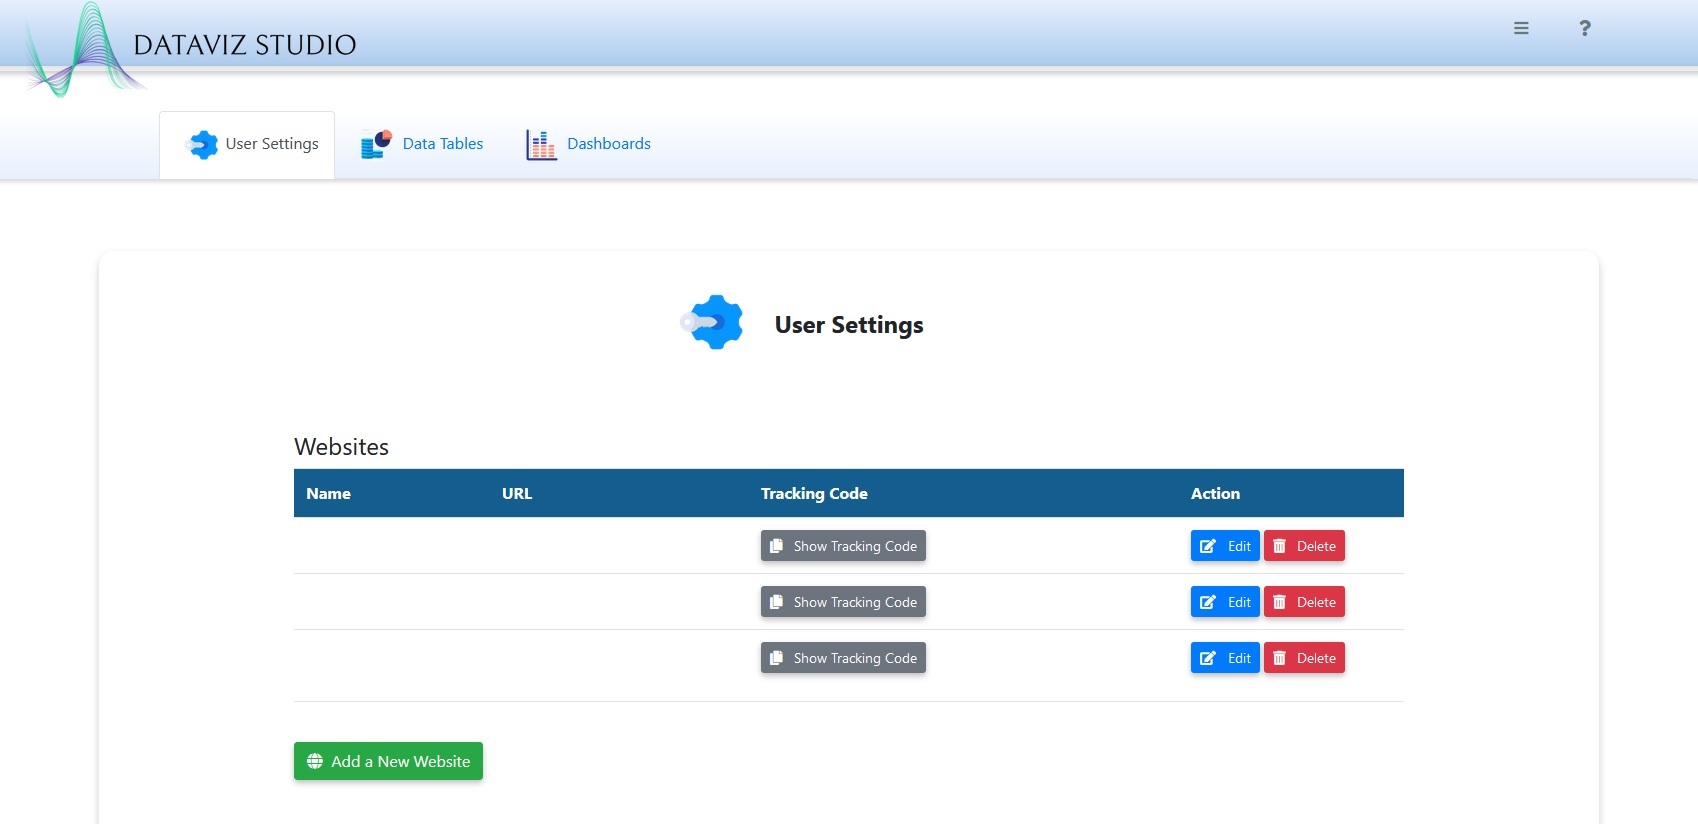
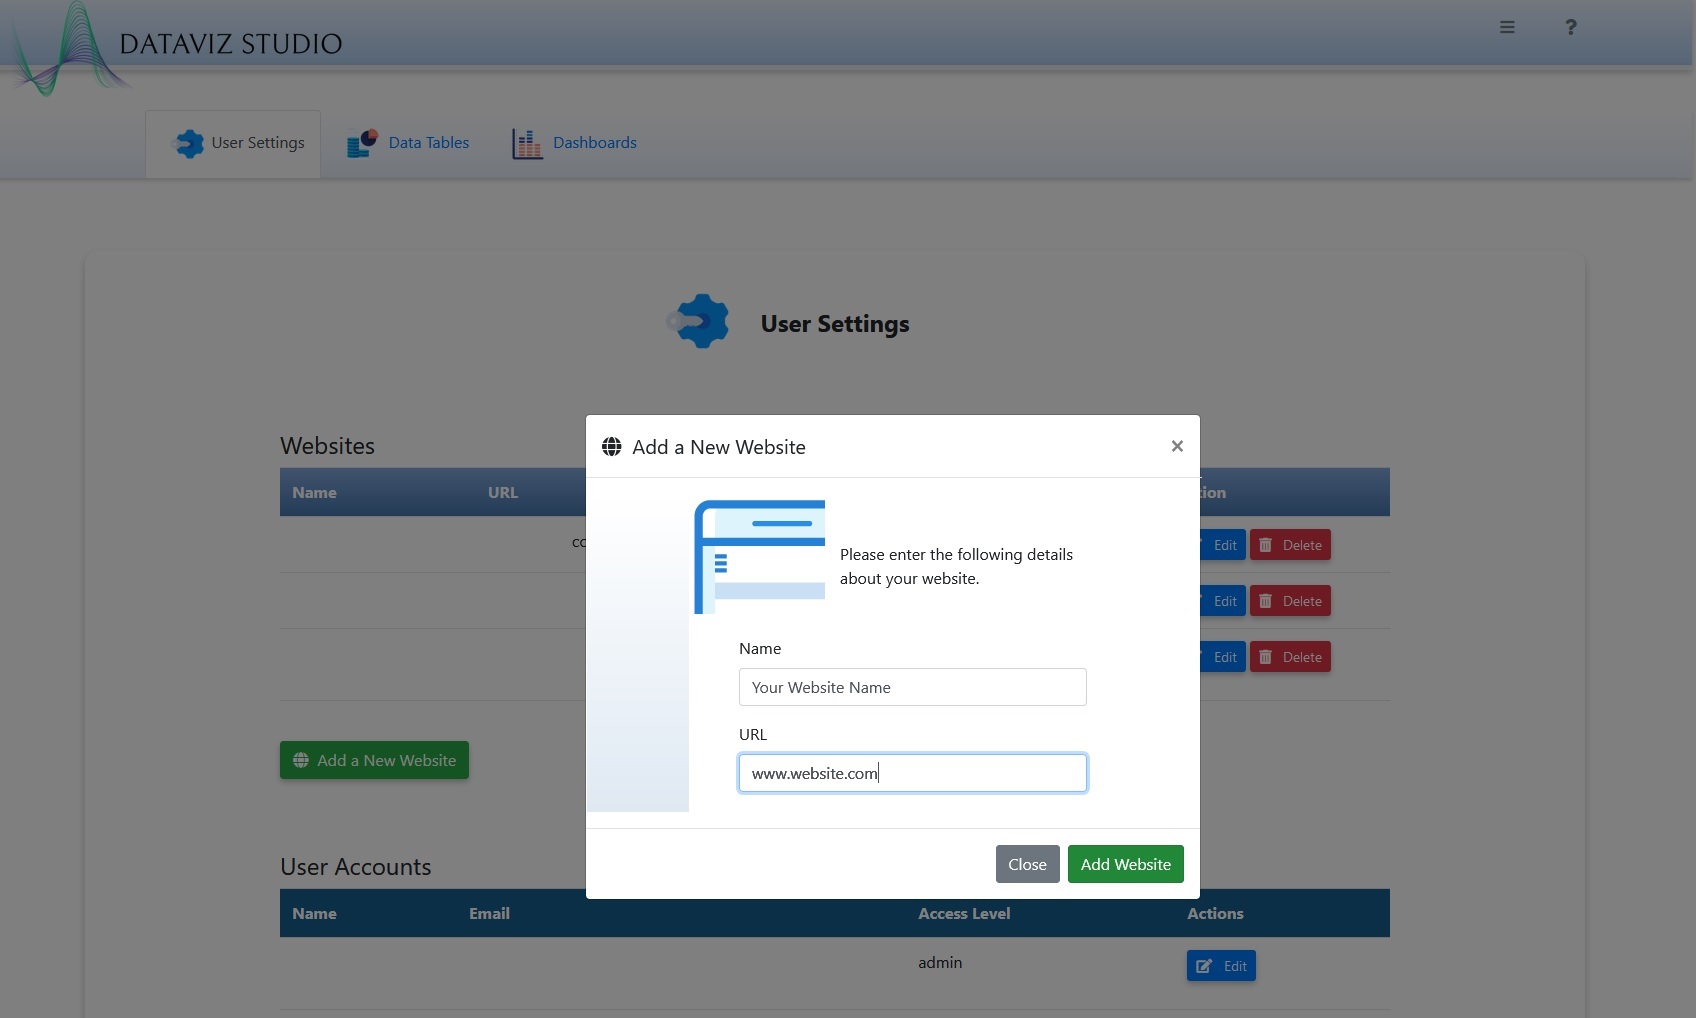
Step 2.Click on 'Add a New Website' button and then enter the website name and URL and click 'Add Website' button.
Step 3.After a website is successfully added, it will be visible in the Websites table. Click on the 'Show Tracking Code' button for that website to view the tracking code.
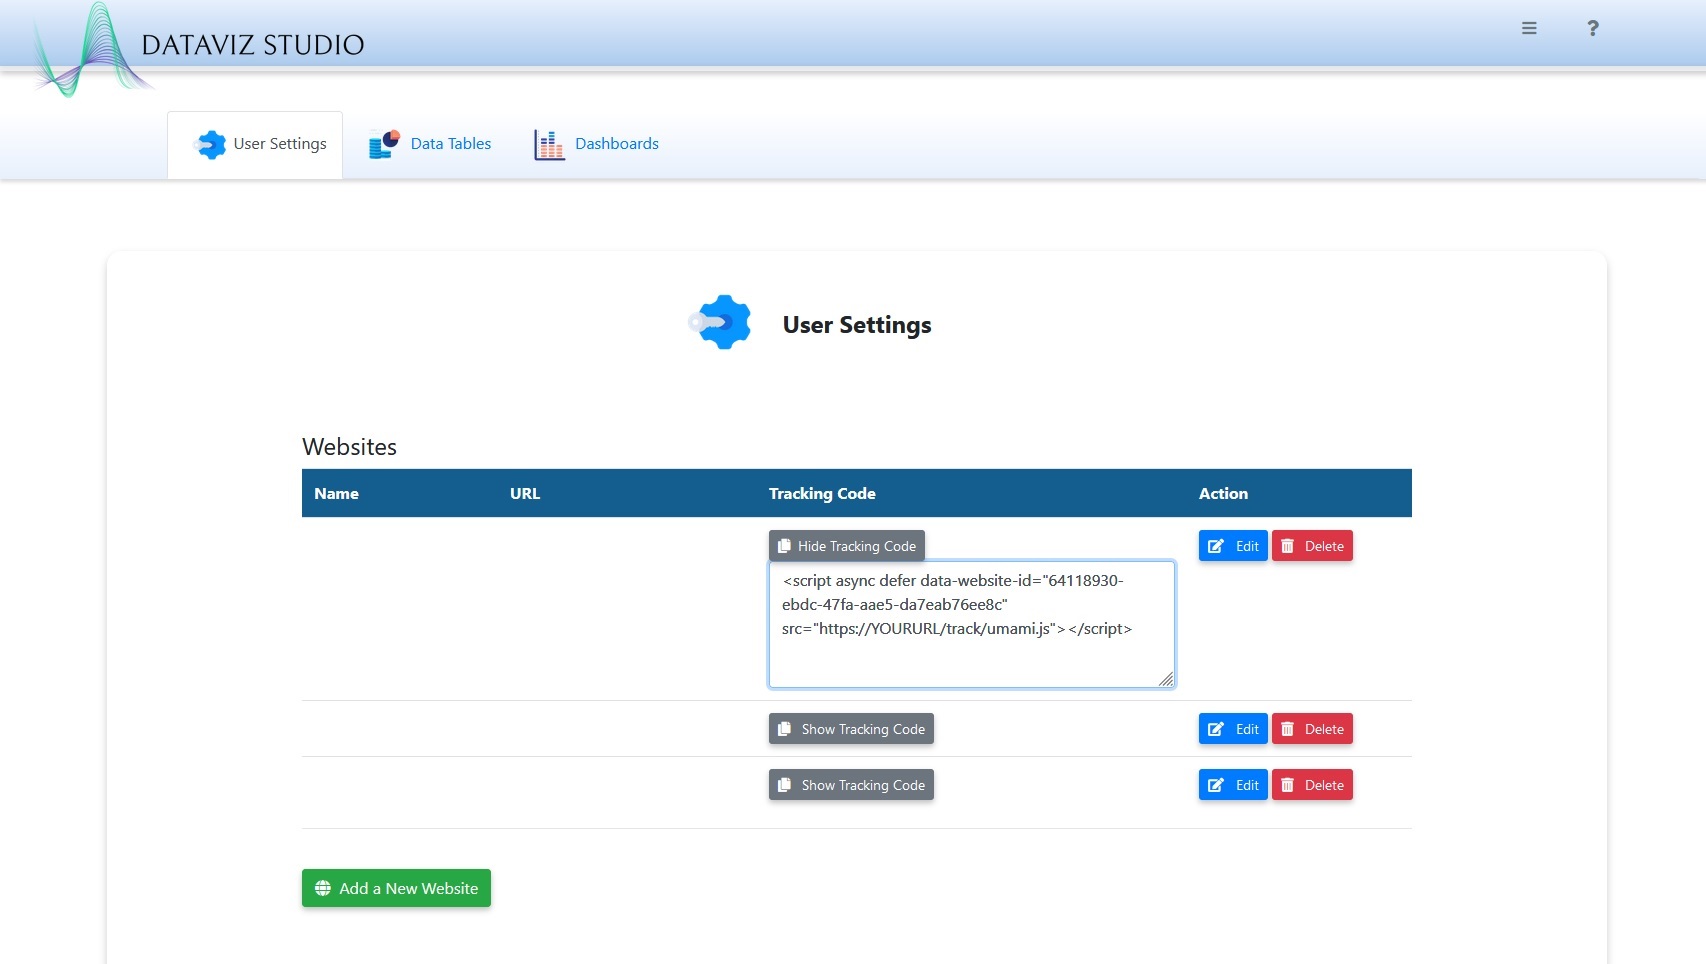
Step 4.Copy the tracking code and insert it inside the head section of each page of your website which you would like to track, as shown below.
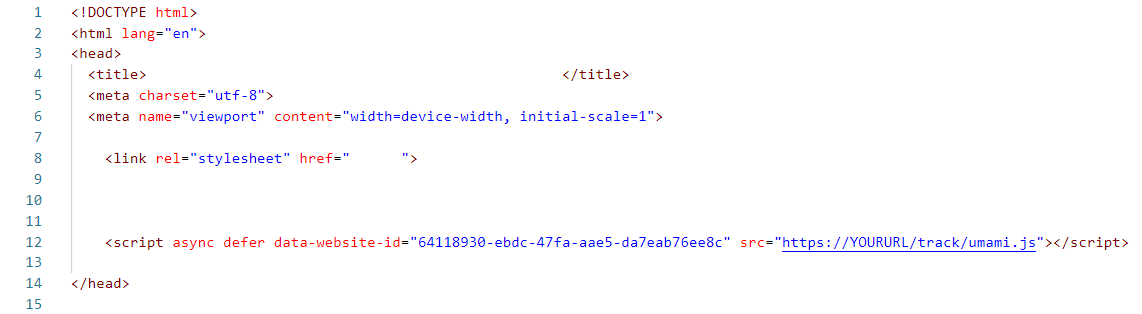
That's it. You can now view your traffic in the dashboard in real-time!
After a website is successfully added, it will be visible in the Websites table. Click on the 'Show Tracking Code' button for that website to view the tracking code.
Step 4.Copy the tracking code and insert it inside the head section of each page of your website which you would like to track, as shown below.
That's it. You can now view your traffic in the dashboard in real-time!
View your Dashboard
Dataviz Studio comes with a few default dashboards which are designed to provide most of the necessary information about your website analytics.
You can click on any of the available dashboards to view them. You can also make changes to the layout and color scheme of an existing dashboard and then save it as a new one.
Dashboard Overview
Following are some of the key features of the dashboard:
You can add multiple graph modules and arrange them (resize and move) as you like and create a unique experience for yourself.
2. Color Schemes
You can choose your own colors to customize the dashboard as you like. You can save color schemes and load them as well.
3. Synchronized Modules
You can choose to make some modules on the dashboard either synchronized or unsynchronized with the dashboard. This means that any update from the dashboard would only affect the contents of synchronized modules and not affect any unsynchronized module.
4. Interactive Graphs
Dataviz Studio provides interactive graphs for a very rich user experience. You can zoom in and out of graphs. You can choose between many differnt types of graphs. You can customize various graph features like width of the bar chart or line chart and so on.
Following video showcases these features:
Add Events to your website
1. CSS Classes
You can capture a user action by simply adding a CSS Class to that HTML Element like a button for example, so whenever a user clicks on this button, an event is generated.
A simple button code looks like this:
<button class="button">Subscribe</button>You would add a CSS Class of the following format to this button:
class="umami--eventType--eventName"Where 'eventType' is the type of an event, for example: click, mouse over or any supported event listed here.
And 'eventName' is the custom name you want to assign to that event, for example: subscribe-button, signup-button, etc.
The complete code for this button will now become:
<button class="button umami--click--subscribe-button">Subscribe</button>2. JavaScript
You can directly call Umami functions to capture any event. There are 2 ways you can do that.
To capture simple events where you don't want to specifiy an event type (it would be assigned a default event type of 'custom'), you can directly call umami(eventName) in your function as shown below:
HTML:
<button id="btnSubscribe">Subscribe</button>JavaScript:
const myButton = document.getElementById('btnSubscribe');
  myButton.onclick = () => umami('Subscription-button-click');
To capture events with both the event type and event name, you can call the umami.trackEvent(eventName, eventType) function as shown below:
HTML:
<button id="btnSubscribe">Subscribe</button>JavaScript:
document.getElementById('btnSubscribe').addEventListener("click", function()
  {
     umami.trackEvent('Subscribe Button', 'Subscription');
  } ,  false);
Further Reading
You can read more about tracking events directly on the Umami website here.
Create your own Dashboard
When you save a dashboard, you save the entire state of the dashboard which is restored when you load the dashboard.
Sending Metrics to Dataviz Studio
1. Metrics Format
2. HTTP POST Request
3. Sample Code
4. Different Sources
5. Visualizing Metrics
1. Metrics Format
The common metrics format is:| Timestamp | Device | Name | Value | Category | Type |
|---|---|---|---|---|---|
| Time of Event | Name of the Device/Application/Source | Name of the Metric/Event | Value of Metric (Numerical) | Category of Metric (Optional) | Type of Metric (Optional) |
2. HTTP POST Request
To send metrics to Dataviz Studio, you simply need to use the REST API HTTP POST method with your metric data and the API Key. You can use a Python script, Perl script or a program written in any other language as it's to implmeent a simple REST API HTTP POST method. To send a single metric, please include the following fields in your HTTP POST method:
Device: Device/Server Name
Name: Name of the Metric, e.g.: CPU, Memory, Temperature, etc.
Value: Numeric value of the metric.
Time: (optional) If not present then current time will be used.
In JSON, this would look like this:
											{

											device: ‘Server Name’,


											name: ‘Server Name: CPU Usage %’,


											value: 10


										}
3. Sample Code
You would need to include the API Key in your HTTP POST Request. You can obtain your API Key from the settings page in Dataviz Studio.As an example, you can refer to the provided sample Node.js application which collects server metrics and sends it to Dataviz Studio.
https://github.com/micronatics/servermetrics/blob/main/metrics.js
In this example, we are using Node.js to send server metrics to Dataviz Studio using a library called Axios.
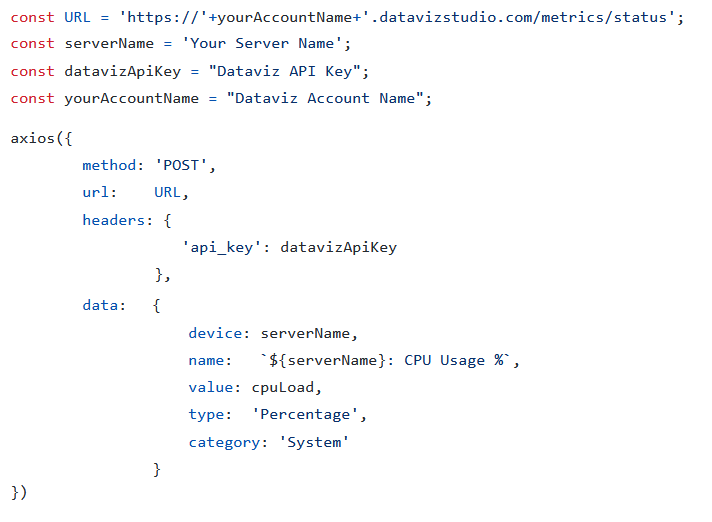
You can easily extend this script if you want to send more metrics/stats about your server or any process to Dataviz Studio.
4. Different Sources
Different Sources require different metrics to be collected and analyzed, that's where the common metrics format becomes very useful as you can use it in a number of different ways to acheive desired results.
Here, we will discuss a few common scenarios
Numerical: Numerical Value includes Temperature, Disk Usage, Memory Usage, or any number
state : ON / off
Multiple Choices: Option1, Option2, Option3
Application Metrics: User Interaction
5. Visualizing Metrics
Dataviz Studio automatically aggregates all Metrics received to allow for fast queries but you still have the option to access the raw data.